| Hour | Temp Max (F) |
Temp Min (F) |
Humidity Avg (%) |
Heat Index Max (F) |
Wind Chill Min (F) |
Wind Avg (mph) |
Wind Max (mph) |
Rain Hour (in) |
Rain To Hour (in) |
Rain Rate Max (in/hr) |
Barometer Avg (inHg) |
|---|---|---|---|---|---|---|---|---|---|---|---|
| 00:00-01:00 | 67 | 67 | 89 | 0 | 0 | 0.00 | 0.00 | 0.0 | 29.88 | ||
| 01:00-02:00 | 67 | 66 | 90 | 0 | 0 | 0.00 | 0.00 | 0.0 | 29.87 | ||
| 02:00-03:00 | 66 | 66 | 90 | 0 | 0 | 0.00 | 0.00 | 0.0 | 29.87 | ||
| 03:00-04:00 | 66 | 65 | 91 | 0 | 0 | 0.00 | 0.00 | 0.0 | 29.87 | ||
| 04:00-05:00 | 65 | 64 | 91 | 0 | 0 | 0.00 | 0.00 | 0.0 | 29.88 | ||
| 05:00-06:00 | 64 | 64 | 92 | 0 | 2 | 0.00 | 0.00 | 0.0 | 29.89 | ||
| 06:00-07:00 | 64 | 63 | 92 | 0 | 0 | 0.00 | 0.00 | 0.0 | 29.91 | ||
| 07:00-08:00 | 67 | 64 | 93 | 1 | 4 | 0.00 | 0.00 | 0.0 | 29.92 | ||
| 08:00-09:00 | 71 | 68 | 91 | 3 | 7 | 0.00 | 0.00 | 0.0 | 29.93 | ||
| 09:00-10:00 | 75 | 71 | 80 | 3 | 8 | 0.00 | 0.00 | 0.0 | 29.93 | ||
| 10:00-11:00 | 77 | 76 | 76 | 4 | 12 | 0.00 | 0.00 | 0.0 | 29.93 | ||
| 11:00-12:00 | 79 | 76 | 74 | 5 | 13 | 0.00 | 0.00 | 0.0 | 29.94 | ||
| 12:00-13:00 | 80 | 79 | 72 | 80 | 6 | 13 | 0.00 | 0.00 | 0.0 | 29.93 | |
| 13:00-14:00 | 81 | 80 | 72 | 85 | 4 | 9 | 0.00 | 0.00 | 0.0 | 29.93 | |
| 14:00-15:00 | 82 | 81 | 69 | 86 | 4 | 11 | 0.00 | 0.00 | 0.0 | 29.92 | |
| 15:00-16:00 | |||||||||||
| 16:00-17:00 | |||||||||||
| 17:00-18:00 | |||||||||||
| 18:00-19:00 | |||||||||||
| 19:00-20:00 | |||||||||||
| 20:00-21:00 | |||||||||||
| 21:00-22:00 | |||||||||||
| 22:00-23:00 | |||||||||||
| 23:00-24:00 |
| Sunrise: 06:03 | Sunset: 20:23 | Moon Phase: Waning Gibbous |
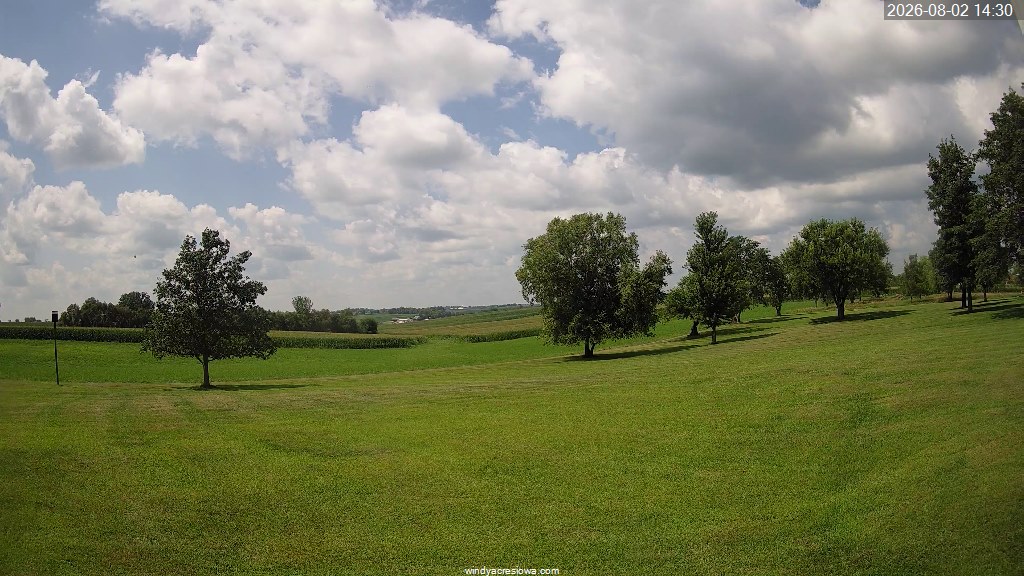
| Current weather @ 2026-08-02 14:54:58 |
| Temperature: 81.7 ℉ Feels like: 85.4 ℉ |
| Temperature Max: 81.9 ℉ Min: 63.0 ℉ |
| Humidity: 68 % Dew Point: 70.2 ℉ |
| Wind: NNE @ 2.9 mph Last 10 min Avg: 3.1mph |
| Max wind gust: 13.0 mph @ 11:35:00 |
| Rain today: 0.00 in. Yesterday: 0.18 in. |
| Rain month: 0.18 in. Year: 26.98 in. |
| Barometer: 29.92 mmHg and Steady |
Weather data refreshed every 5 minutes.
| Year | Temp Max (F) |
Temp Min (F) |
Temp Avg (F) |
Heat Index Max (F) |
Wind Chill Min (F) |
Wind Max (mph) |
Rain Day (in) |
|---|---|---|---|---|---|---|---|
| 2026 | 82 | 63 | 71 | 86 | 13 | 0.0 | |
| 2025 | 78 | 57 | 68 | 15 | 0.0 | ||
| 2024 | 85 | 67 | 76 | 93 | 15 | 0.0 | |
| 2023 | 79 | 68 | 73 | 12 | 0.0 | ||
| 2022 | 89 | 69 | 79 | 107 | 25 | 0.0 | |
| 2021 | 79 | 56 | 67 | 12 | 0.0 | ||
| 2020 | 80 | 61 | 71 | 82 | 16 | 0.0 | |
| 2019 | 84 | 59 | 72 | 85 | 14 | 0.0 | |
| 2018 | 79 | 64 | 72 | 20 | 0.0 | ||
| 2017 | 85 | 65 | 75 | 88 | 9 | 0.0 | |
| 2016 | 82 | 70 | 76 | 87 | 10 | 0.0 | |
| 2015 | 90 | 67 | 79 | 100 | 30 | 0.0 | |
| 2014 | 85 | 60 | 73 | 86 | 7 | 0.0 | |
| 2013 | 84 | 64 | 74 | 86 | 21 | 0.0 | |
| 2012 | 93 | 71 | 82 | 92 | 17 | 0.0 | |
| 2011 | 98 | 75 | 86 | 117 | 22 | 0.0 | |
| 2010 | 83 | 70 | 77 | 90 | 10 | 0.1 | |
| 2009 | 80 | 53 | 69 | 81 | 24 | 0.0 | |
| 2008 | 82 | 64 | 74 | 82 | 11 | 0.0 | |
| 2007 | 87 | 69 | 79 | 93 | 10 | 0.0 | |
| 2006 | 91 | 78 | 84 | 98 | 22 | 0.0 | |
| 2005 | 96 | 68 | 83 | 103 | 11 | 0.0 | |
| 2004 | 86 | 64 | 74 | 92 | 9 | 0.1 | |
| 2003 | 84 | 61 | 72 | 85 | 18 | 0.0 | |
| 2002 | 81 | 61 | 71 | 82 | 18 | 0.0 | |
| 2001 | 91 | 75 | 80 | 106 | 8 | 0.2 | |
| 2000 | 84 | 68 | 75 | 85 | 19 | 0.0 |
*Weather data available from 1/1/2000 to present. Data prior to 2019 obtained from NWS at Iowa City Airport, located 16 miles NNE.
Pre-2019 data is hourly summary. Wind Chill Min and Heat Index Max are estimates based on extremes during that hour.
Pre-2019 data is hourly summary. Wind Chill Min and Heat Index Max are estimates based on extremes during that hour.